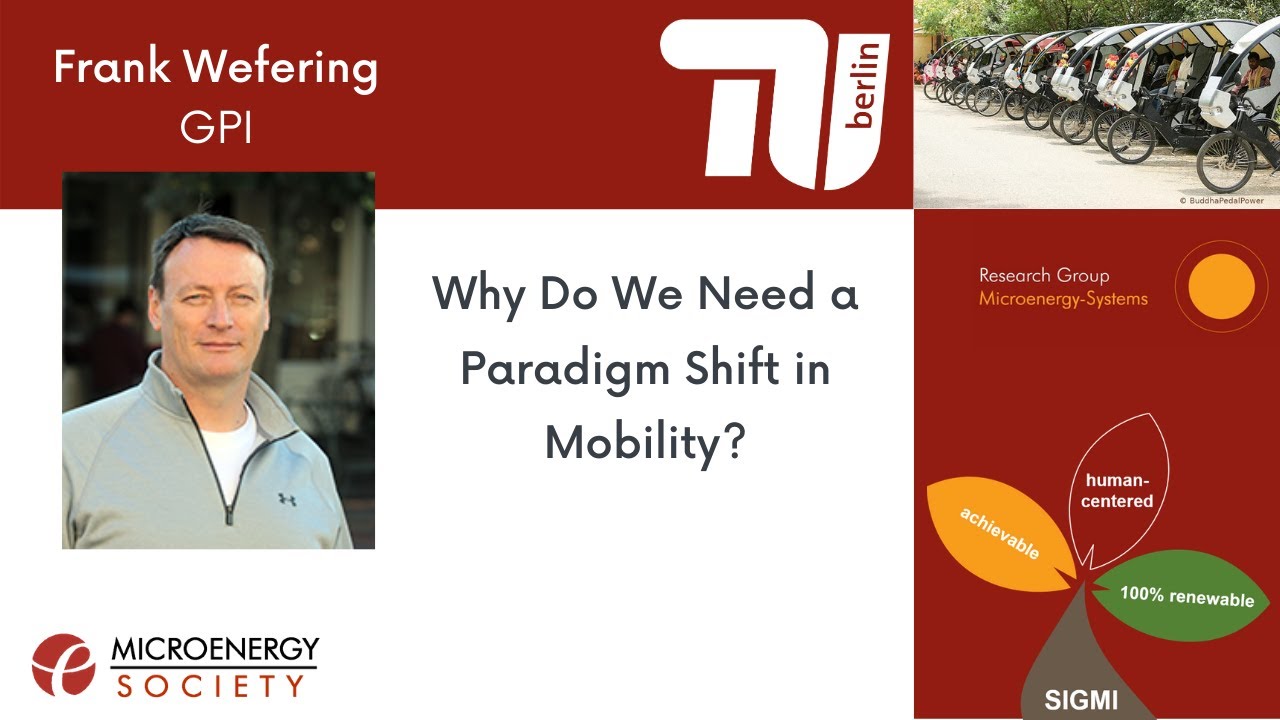
SIGMI Conference on Sustainable & Inclusive Mobility - Paradigm Shift in Mobility by Frank Wefering
Keywords
Summary
156 words
Critical Evaluation
Value of the Information & Strength of the Argument
The value of the information lies in its synthesis of multiple well-established concepts and data points, making a compelling case for a paradigm shift. The argumentation is logical and structured, moving from problems (congestion, pollution, health, safety, equity) to solutions (SUMP, Complete Streets, Vision Zero). The speaker’s professional background in engineering and planning adds practical credibility. However, the presentation is largely expository without deep critical analysis or comparison of alternatives, and some claims lack detailed citations. The reasoning is persuasive for a general audience but not a rigorous academic review.
Scientific Rigor, Source Quality, Title Accuracy
The presentation references sources such as the World Health Organization, European Commission guidelines, and research on congestion costs, but without providing specific URLs or formal citations. The speaker mentions ELTIS (though misspelled as ‘altis’) and company projects, but these are not detailed. The title accurately matches the content. No public comments were provided for analysis.
160 words
Title / Content Match
The title accurately reflects the content, as the speaker discusses the need for a paradigm shift in mobility planning and presents relevant concepts and examples.
Quality & Reliability
7/10
The presentation cites specific statistics and references from WHO, research studies, and European Commission initiatives, but relies mostly on the speaker's professional experience. Sources are not formally cited in a scientific manner, though the data appears credible.
Key Moments
Markers derived by PSI from the transcript: the creator did not define chapters.
- Introduction by Frank Wefering, background as sustainability director at GPI
- Defines transport vs. mobility, emphasizing access to services
- Presents congestion costs: $124 billion per year in the US, equivalent to $1 per person per day
- Discusses transport as top source of climate emissions and air pollution impacts
- Highlights health issues from inactivity and road fatalities (1.35 million annually)
- Addresses gender-based harassment and the 'pink tax' in transport
- Critiques car-dependent society and induced traffic, showing examples
- Introduces sustainable mobility planning concepts, focusing on SUMPs and EU policy
- Explains the mobility pyramid and multimodal street design principles
- Presents Complete Streets approach and tactical urbanism examples
- Discusses Healthy Streets from London and Vision Zero from Sweden
- Summarizes drivers of change: planning for people, bottom-up approaches, and health/safety concerns
Cited Sources
- MicroEnergy Research Group website — Provided in the video description as a resource for more information about the group and its events.
Concurring Sources
- ELTIS - European Mobility Observatory — Referenced in the presentation (misspelled as altis) as a resource for SUMP guidelines and best practices.
Contribution & Novelties
The presentation brings together several well-known sustainable mobility concepts and advocates for a paradigm shift from car-centric to people-centric planning. It provides a clear introduction to frameworks like SUMP, Complete Streets, and Vision Zero, and highlights often-overlooked issues such as the gender-specific costs of transport. The speaker’s practical experience in engineering adds a professional perspective.
Pour aller plus loin :
- Sustainable Urban Mobility Plan (Wikipedia) — Useful overview of the SUMP concept and its implementation in Europe.
- Vision Zero (Wikipedia) — Background on the Swedish road safety framework and its global adoption.
- Complete Streets (Wikipedia) — Details on the US policy and design approach for streets serving all users.
- Pink tax (Wikipedia) — Explanation of the gender-based price differences, applicable to transport costs mentioned.
124 words
Radar Profile
The radar profile shows moderate to high scores in information quantity, quality, and reliability, with a lower technical level. This reflects a well-informed but non-technical presentation aimed at a broad audience, focusing on concepts and data rather than deep technical analysis.