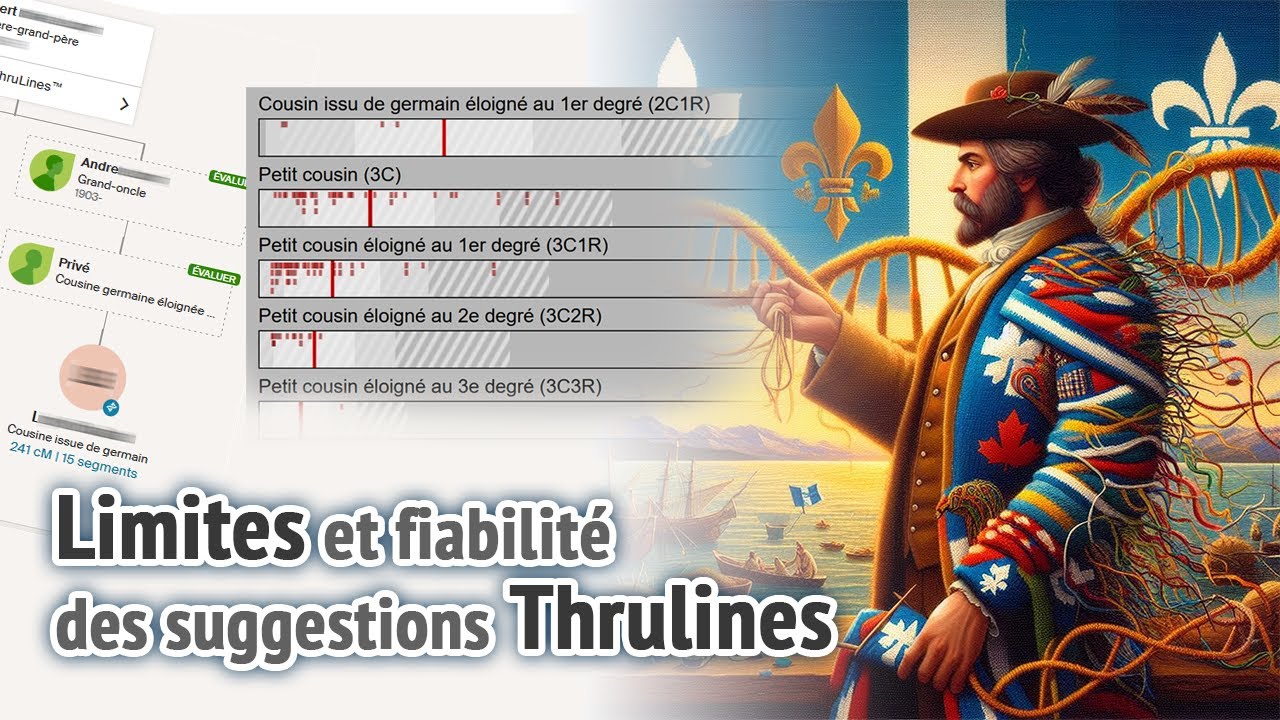
Limites et fiabilité des suggestions Thrulines
Limits and reliability of Thrulines suggestions
Keywords
Summary
276 words
Critical Evaluation
Value of the Information & Strength of the Argument
The informational value lies mainly in the concrete, quantified illustration of a well-known but rarely measured phenomenon: the explosive growth of suggested matches as one moves up the pedigree, and the concentration of those suggestions on a single branch. The author is careful to frame his own figures as anecdotal rather than representative, which is the correct epistemic stance for a sample of one. The argumentation is built on a clear chain: define the feature, show the raw counts, project them onto an established reference distribution, then test individual suggestions against that distribution. The strongest part is the use of the Shared cM Project bands and their standard deviations to convert a vague intuition (’this looks wrong’) into a quantified statement (’this value lies beyond two standard deviations, and the probability table assigns under 1% to the suggested relationship group’). The author also correctly notes that the probability figures apply to a group of relationships rather than to a single one, which is a subtle but important distinction that is often mishandled. The weaker points are the absence of any attempt to estimate how often Thrulines suggestions are actually confirmed by documentary research, and the reliance on visual reading of the bands rather than on an explicit computation of z-scores. The double-cousin discussion is valuable because it explains a structural cause of inflated match counts rather than treating them as noise. Overall the reasoning is internally consistent, the caveats are stated before the conclusions rather than after, and the practical recommendation (verify everything, especially outliers) follows directly from the evidence presented.
Scientific Rigor, Source Quality, Title Accuracy
On scientific rigour, the video relies on two external references: the Shared cM Project distributions as displayed on DNA Painter, and AncestryDNA’s own documentation stating that Thrulines does not validate relationships. Both are used appropriately, and the author quotes Ancestry’s disclaimer rather than paraphrasing it into something stronger. The statistical vocabulary is used correctly: standard deviation, one and two sigma intervals, 68% and 95% coverage, and outlier as a value far from the mean. The main methodological gap is that the reference distributions are treated as fixed truth without discussing their own uncertainty, sample composition or the fact that they are themselves built from self-reported genealogies, which is precisely the kind of data the video criticises elsewhere. The probability percentages quoted from Ancestry’s table are read as if they were independent per relationship, whereas the author himself notes they apply to a group, and he does not fully resolve that tension. No academic paper, no peer-reviewed source and no independent validation study is cited. On source quality, the video is therefore a well-reasoned practitioner analysis rather than a documented review. Regarding title-content adequacy, the title is fully honoured: limitations and reliability are the explicit subject and occupy the majority of the runtime. No comments were provided for analysis.
484 words
Title / Content Match
The title announces exactly what is delivered: limitations and reliability of Thrulines, treated through a personal Sankey diagram, cM distributions and two contradictory estimates.
Quality & Reliability
7/10
The video is a personal, transparent case study: the author explicitly labels his own numbers as anecdotal, distinguishes what AncestryDNA itself states (Thrulines does not validate relationships) from his own statistical reading, and uses the Shared cM Project distributions and standard deviations correctly. No external literature is cited and the sample is a single individual, so the conclusions are illustrative rather than generalizable, but the reasoning is sound and the caveats are stated repeatedly.
Chapters
- intro
- 4 thèmes abordés
- fonctionnalité Thrulines et conditions
- accéder à ses Thrulines
- cas exemple
- diagramme Sankey personnel
- double cousins
- redescendre les lignées de matchs
- sur la grille Shared cM Project
- fiabilité et limitations
- diagrammes à bandes
- écart-type (déviation standard)
- signification des écart-types
- positions en cM des Thrulines d'arrière-grands-parents
- donnée aberrante (outlier)
- 1ère estimation contradictoire
- positions en cM des Thrulines d'AA-grands-parents
- 2e estimation contradictoire
- mise en garde d'Ancestry
- autres points d'attention
- conclusion
Cited Sources
- Shared cM Project (hosted on DNA Painter) — Reference grid of centimorgan ranges and standard deviations per relationship, used to position the author's Thrulines suggestions and to identify outliers.
- AncestryDNA — Thrulines — Ancestry's own documentation, quoted in the video for its disclaimer that Thrulines does not validate relationships and is intended to help users draw their own conclusions.
Concurring Sources
- Shared cM Project (hosted on DNA Painter) — The centimorgan ranges and standard deviations used in the video match the published distributions of this reference dataset.
- AncestryDNA — Thrulines — Ancestry's own statement that Thrulines does not validate relationships corroborates the video's central cautionary message.
Contribution & Novelties
The video’s original contribution is not a new finding but a transfer of method: it takes a statistical tool designed for interpreting a single DNA match (the Shared cM Project bands and their standard deviations) and applies it to the aggregate output of Thrulines, treating each suggestion as a data point to be tested against the expected distribution for the relationship it claims. This turns a qualitative warning (‘Thrulines is only a suggestion’) into a quantitative diagnostic, and it produces two concrete worked examples where the suggested relationship falls far outside the expected band and where Ancestry’s own probability table assigns well under 1% and under 7% to the relevant relationship group. A second original element is the use of a personal Sankey diagram to visualise the asymmetry of suggestions across branches and across generations, which makes visible both the tenfold increase between the great-grandparent and great-great-grandparent levels and the total absence of suggestions on one branch, explained by low testing rates in that region rather than by absence of kinship. The double-cousin analysis adds a structural explanation for inflated match counts that is often mistaken for endogamy.
Pour aller plus loin :
- Centimorgan — Unit of genetic distance underlying all the cM values discussed in the video.
- Pedigree collapse — Explains the implex situations the author identifies as a source of bias in Thrulines suggestions.
- Endogamy — Directly relevant to the multiple-common-ancestor problem described in the limitations section.
- Shared cM Project, Blaine Bettinger — The original data collection behind the DNA Painter grid; cited by name as the author refers to the tool without naming its originator.
- Identical by descent — Conceptual basis for deciding whether a shared segment reflects a real genealogical link.
285 words
Radar Profile
The profile is that of a practitioner-led case study: high on informational density and on internal consistency, moderate on technical depth because the statistics are used descriptively rather than derived, and limited on global reliability by the absence of any external or peer-reviewed corroboration. The overall shape is a solid, honest, single-case analysis rather than a documented review.